J-BornSoft :Company:
:Products:
:Technology:  


 Beam Profile


 LED driver


 Software
TOP

Beam Profile Measurement System

Beam Profile Measurement System measures the light emission pattern of a light source. The light source can be LED, optical fiber output, or waveguide output. It is very important to know the beam profile because Photonics deals with light. For example, a lens is prepared to focus the light of a LED. The lens should have proper size and curvature to focus the light efficiently. The beam shape of the LED should be known to determine the size and curvature of the lens. In addition, you may need to know the beam divergence.

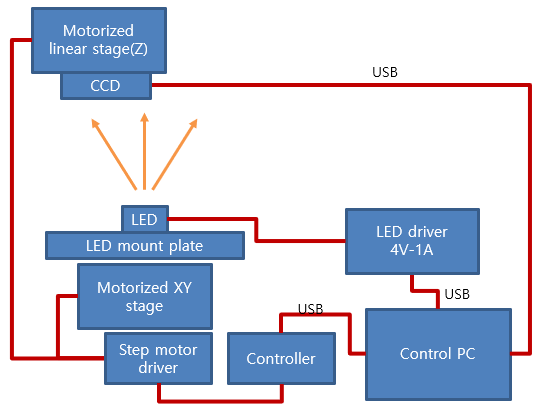
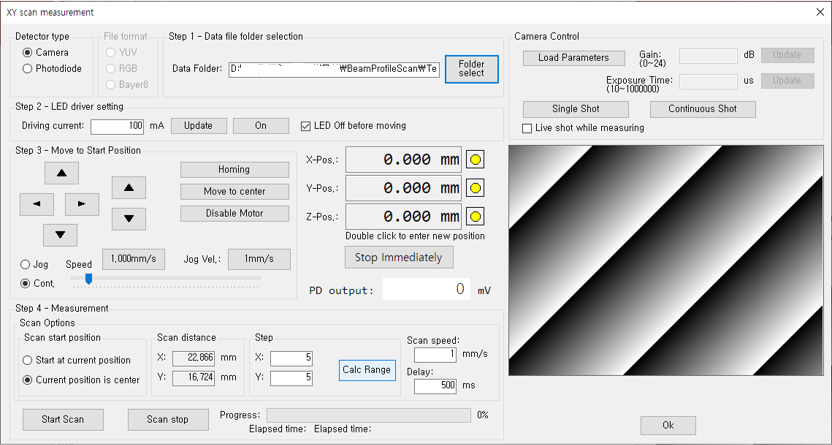
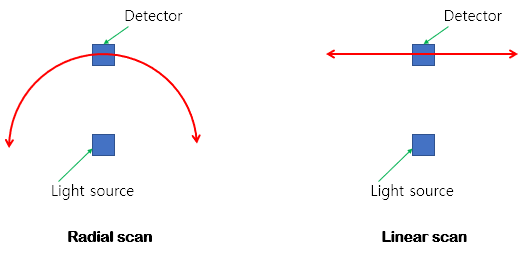
A detector such as a photodiodoe, a CCD or a spectrometer is attached to a moving stage. A control GUI program controls the moving stage. The moving stage moves around the light source. It moves in a radial or linear direction.

Beam scan method

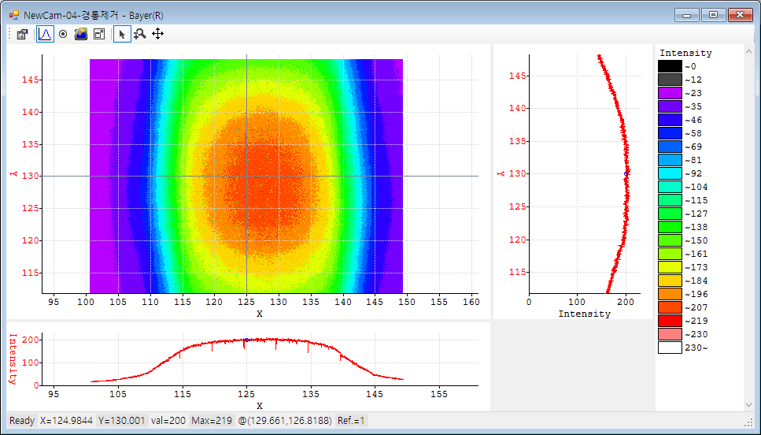
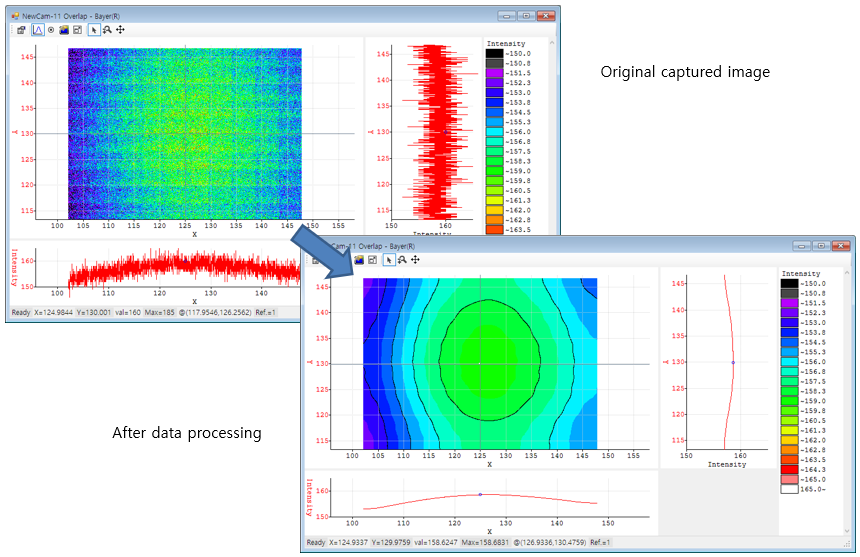
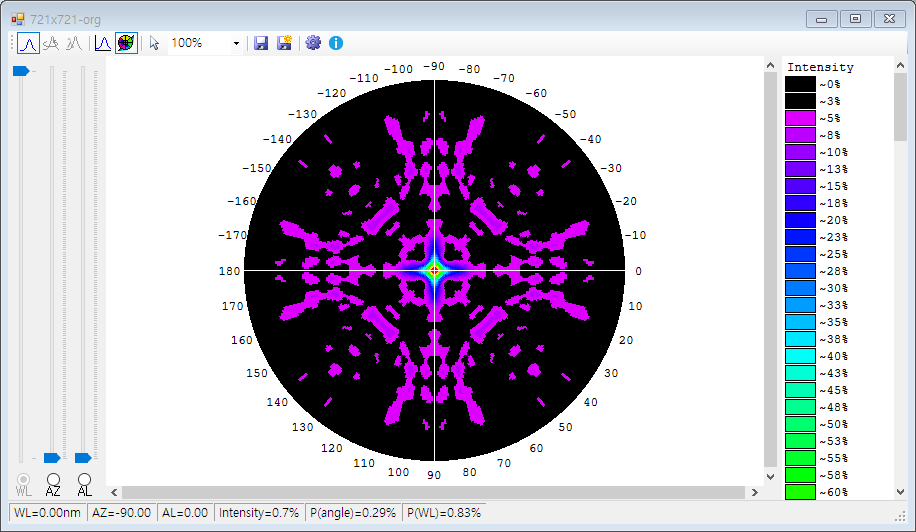
The GUI measures the detector output while it moves the detector. The measured detector output data are analyzed according to the detector position to calculate the beam profile. The GUI displays the beam profile graphically. The following picture shows the example of LED beam profile.

Beam Profile Example

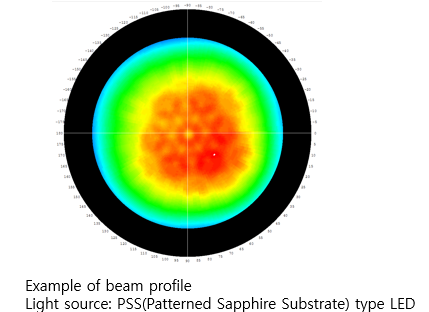
The detector moves in radial direction. Red color denotes higher intensity and blue color denotes lower intensity.

The beam profile measurement system can be configured according the customer's needs. The detector can move in radial direction or linear direction. The detector can be a photodiode or CCD sensor. The light source stage is fully customizable.

Beam Profile Measurement System

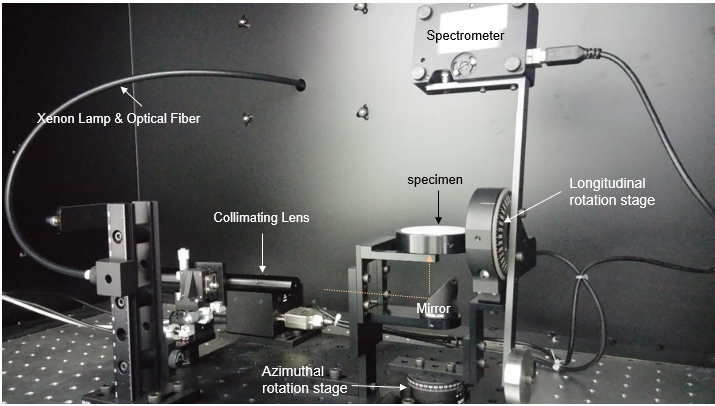
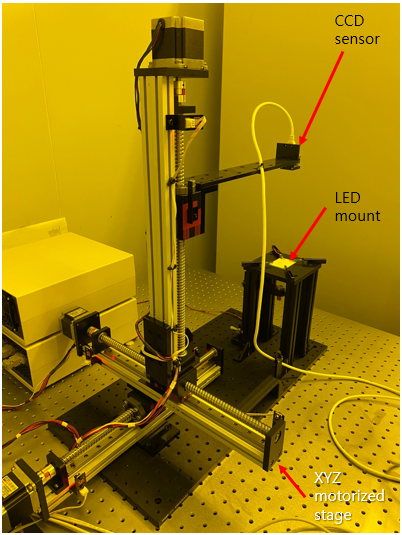
The above photo shows example of beam profile measurement system. It has radial scan stages and the detector is a spectrometer. The light source is Xenon lamp. The follwing beam profile measurement system uses linear moving stages for scanning. The detector is CCD sensor and the light source is LED.

Beam Profile Measurement System

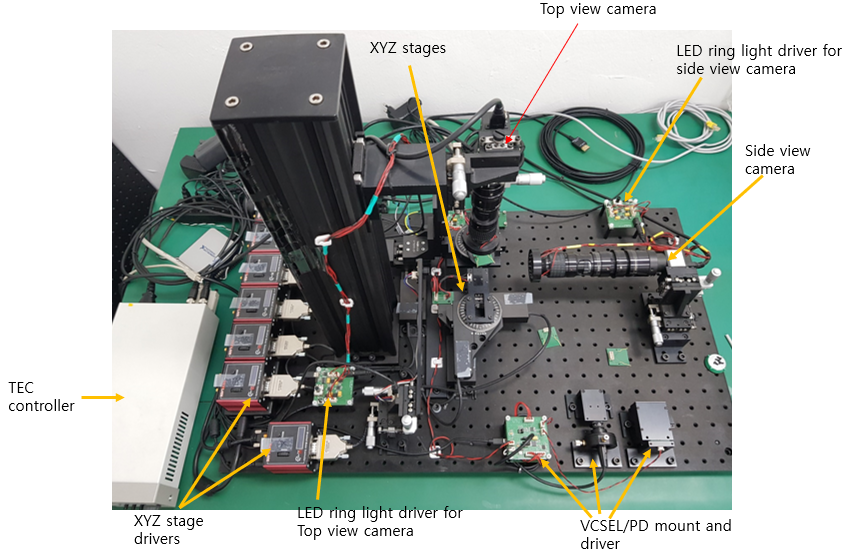
Several options can be added as well. The following system evaluates the lens array. It has two cameras to observe the lens array. TEC controller controls the thermoelectric cooler that is attached the sample holder to maintain the temperature of the light source. 6 motorized linear stages and 2 motorized rotation stages are used to measure the characteristics of the lens array precisely. 

Beam Profile Measurement System

All beam measurement systems are customized. You can choose the type and vendor of the moving stages. The detector type can be selected. If you are not sure which moving stages and detectors are suitable for you, just leave it to us, We will think and decide for you.

Typical block diagram and measurement process

Although there are so many different types of beam profile measurement system, one of the block diagrams is shown as follows to explain the configuration of a beam profile measurement system.

BPM setup

The above system has 3 motorized linear moving stages. 2 moving stages are used for 2-dimensional area scan and 1 moving stage is used to adjust the distance between the light source and the detector. The 3 moving stages are controlled by the control PC. The control PC also controls the LED driver. The LED driver supplies constant current to a LED. The LED can be turned on or off by the control PC. the current of the LED can be adjusted as well. The XY stage moves the CCD to start position and the control PC captures the CCD image. And then, the CCD moves to the next postion and the CCD image is captured. This process will continues until the area scan is finished. The control GUI will combine the CCD images to make a big image and shows the result graphically.

BPM GUI

The above picture is the screen capture image of the control GUI. The user can enter several measurement parameters including the scan distance, scan steps, scan speed, CCD gain, exposure time and so on. The measurement process will begin when the Start Scan button is pressed. The control GUI captures the CCD images while it moves the stages. The GUI shows the result after finishing the scan. The following section shows examples of measurement results.

Examples of measurement results

Multiple CCD images are captured in the above beam profile measurement. The following example is the image which is reproduced by combining 10x10 CCD images. The images are merged seamlessly.

BPM result

The measured image can be enhanced by data processing if it is necessary. For example, areal averaging reduces noise components and interpolation increases image resolution.

BPM data processing

The following pictures show examples of measurement results for various beam profile measurement systems.

BPM measurement result

BPM measurement result

BPM measurement result

BPM measurement result


Copyright (C) 2022 J-BornSoft